728x90


I had to handle high traffic loads in my career and I fought with down-time, not used memory and a lot of trouble in my past. In this article I want to give a step-by-step guide to apache2 performance settings, which is a concentrated result of a lot of reading and trying.

My environment

Precalculation of average memory usage and maxclients/max-children

1. Calculate process size

You need to know how many processes can run on your machine. So calculate the process size of your main CPU/memory drivers is necessary.

There are several calculation methods out there. Personally I prefer this python script as it takes shared memory into account and will give insights into real memory usage.

cd ~
wget https://raw.githubusercontent.com/pixelb/ps_mem/master/ps_mem.py
chmod a+x ps_mem.py
sudo python ps_mem.py

ps_mem.py will produce output like this:

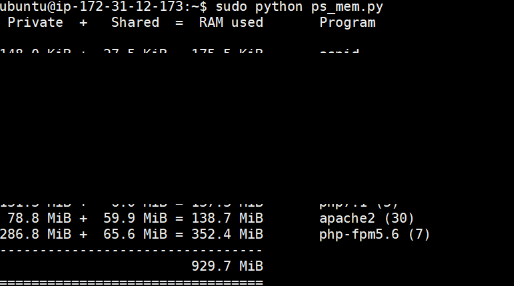
Here you can see that there are 30 apache2 processes, consuming a total of 352 MiB, so each Apache process is using roughly 12MiB of RAM. The php-fpm5.6 process will use about 50MiB.

2. Calculate apache MaxRequestWorkers

To be safe though, I’ll reserve 15% of memory for all other processes (in my case ~1,2GiB) and round up apache process size to 15MiB.

MaxRequestWorkers = (Total RAM - Memory used for Linux, DB, etc.) / process size
MaxRequestWorkers = (8192MB - 1200MB) / 15MB = 466

3. Calculate php-fpm max-children

To be safe though, I’ll reserve 1 GiB for all other processes and round up php process size to 55MiB.

maxclients = (Total RAM - Memory used for Linux, DB, etc.) / process size
maxclients = (8048MB - 1024MB) / 55MB = 128

My colleague Thomas prepared this Excel Sheet for the calculation: https://s3.buckpesch.io/downloads/apache_performance.xlsx

Detailed Setup

In the /etc/apache2/mods-enabled/mpm-event.conf or /etc/apache2/mods-enabled/mpm-worker.conf file:

<IfModule mpm_*_module>
ServerLimit (Total RAM - Memory used for Linux, DB, etc.) / process size
StartServers (Number of Cores)
MinSpareThreads 25
MaxSpareThreads 75
ThreadsLimit 64
ThreadsPerChild 25
MaxRequestWorkers (Total RAM - Memory used for Linux, DB, etc.) / process size
MaxConnectionsPerChild 1000
</IfModule>

Note that the default settings did not contain the “ServerLimit”, so I added it here.

In the /etc/php/7.1/fpm/pool.d/www.conf change the following settings:

pm = dynamic            
pm.max_children (total RAM - (DB etc) / process size)
pm.start_servers (cpu cores * 4)
pm.min_spare_servers (cpu cores * 2)
pm.max_spare_servers (cpu cores * 4)
pm.max_requests 1000

To learn about all php-fpm settings I recommend watching the video on that page: https://serversforhackers.com/c/php-fpm-process-management

My final settings

My server has 16GB RAM and 4 CPUs à 2,4GHz. My avarage apache process has 15MB, an average PHP process takes 55MB.

/etc/apache2/mods-available/mpm_event.conf

# Optimized settings for avg. apache process 15MB and AWS EC2 m4.xlarge Server
<IfModule mpm_event_module>
ServerLimit 925
StartServers 4
MinSpareThreads 25
MaxSpareThreads 75
ThreadLimit 64
ThreadsPerChild 25
MaxRequestWorkers 925
MaxConnectionsPerChild 1000
</IfModule>

/etc/php/7.1/fpm/pool.d/www.conf

; Optimized for php-fpm request size of 55MB on AWS EC2 m4.xlarge (4CPU cores, 16GB RAM)
pm = dynamic
pm.max_children = 200
pm.start_servers = 20
pm.min_spare_servers = 10
pm.max_spare_servers = 20
pm.max_requests = 1000

Save your settings and restart your apache and php-fpm processes

sudo service apache2 restart
sudo service php7.1-fpm restart
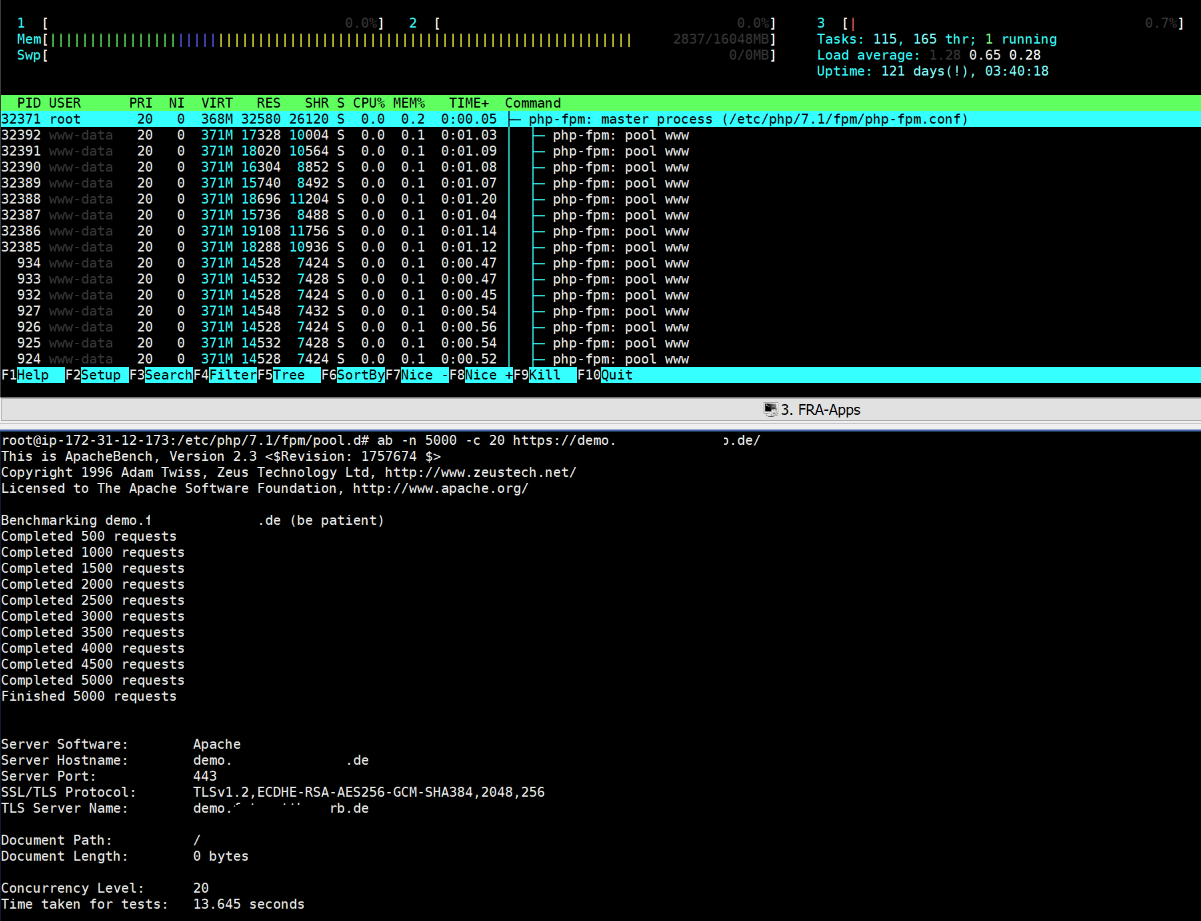
Test you settings

To test your server settings you can run Apache Bench tests and see how your server behaves in htop .

Open 2 terminals and the following command to test 5000 requests with a concurrency of 100 parallel requests:

ab -n 5000 -c 100
Load test using apache bench

I hope this helps. Drop me a line, when you have other experience or think I might can improve my formular/calculation. As well I might create a simple web-interface to calculate the settings… But now I have to go back to work ;-)

References


728x90

htop is a Linux process monitoring tool, It is an alternative tool for top command, Which is the standard and the default process Monitoring tool in Linux and Unix Operating System. But htop on CentOS 7 is more user friendly and output is easy to read compared to the Linux top command.

In this Tutorial We are going to learn how to Install htop on CentOS 7 using yum install command with epel repository.

To Install htop on CentOS 7 We Want to add CentOS epel repository, Because the htop software package does not come with Default CentOS yum repository.

Start Amazon Prime 30-day Trial - Instantly watch over 40,000 movies and TV episodes

Step One

Install Epel Release

First, enable the epel release on CentOS 7.

yum -y install epel-release

Step Two

install htop With Yum Command

Now we can install CentOS htop using yum install command.

yum -y install htop


Now to start htop program, Open Linux Terminal and type htop

centos install htop

You can see the output of the htop process monitoring tools is more readable and easy understand.

Summary : htop CentOS 7

  • In this tutorial we installed htop on Linux CentOS 7 using epel repository.
  • First, we enable the epel-release and then install htop using yum command (Without epel-release you will receive the following error "No package htop available").

We can also use this same method to install htop on CentOS 6.5 and older versions.

728x90


I try to install Apache Benchmark using Is there a way to install Apache Bench (ab) without installing apache solutions on my centos but when i run yumdownloader httpd, i get error:

root@local [~/httpd]# yumdownloader httpd
Loaded plugins: fastestmirror
Loading mirror speeds from cached hostfile
 * base: yum.phx.singlehop.com
 * elrepo: repos.lax-noc.com
 * extras: centos.tcpdiag.net
 * updates: mirror.stanford.edu
No Match for argument httpd
Nothing to download

What is it? and how can i fixed it?

Edit 1: i try to use Michael Hampton way but i get this errors:

root@local [~]# yum provides /usr/bin/ab
Loaded plugins: fastestmirror, security
Loading mirror speeds from cached hostfile
 * base: yum.phx.singlehop.com
 * elrepo: repos.lax-noc.com
 * extras: centos.tcpdiag.net
 * updates: mirror.stanford.edu
No Matches found

root@local [~]# yum install httpd-tools
Loaded plugins: fastestmirror, security
Loading mirror speeds from cached hostfile
 * base: yum.phx.singlehop.com
 * elrepo: repos.lax-noc.com
 * extras: centos.tcpdiag.net
 * updates: mirror.stanford.edu
Setting up Install Process
No package httpd-tools available.
Error: Nothing to do

You can discover which package contains the program you want using yum provides:

yum provides /usr/bin/ab

Then you will see that ab is in the httpd-tools package.

And now you can install it:

yum install httpd-tools


    728x90

    ab 프로그램은 웹 서버를 벤치마크하기 위해 Apache 웹 서버와 함께 제공됩니다. Watson™ Explorer Engine은 일반적으로 웹 서버 내에서 CGI 실행 파일로 실행되므로 웹 서버의 작동 성능을 파악하는 것이 유용합니다. ab 애플리케이션은 현재 Apache 설치의 작동 성능에 대한 정보를 제공하도록 설계되었으며, Apache 설치가 서비스할 수 있는 초당 요청 수를 요약해서 보여줍니다.

    이 정보는 Watson Explorer Engine이 실행 중인 상태에서 Watson Explorer Engine과 독립적으로 웹 서버에서 처리할 수 있는 최대 로드를 판별하는 데 유용합니다. ab 애플리케이션은 Watson Explorer Engine이 실행 중인 동안 웹 서버를 테스트할 수 있으므로 일반 사용자 관점에서 전체 애플리케이션의 성능에 대한 정확한 벤치마크를 가져올 수 있습니다.

    ab 애플리케이션은 Apache 설치 패키지의 일부로 설치됩니다. 대부분의 Linux 배포에서 이 애플리케이션은 httpd-tools 패키지에 포함되어 있습니다. ab유틸리티를 확보하는 방법에 대한 정보는 사용 중인 운영 체제에 대한 Apache 문서를 참조하십시오.

    다음은 ab 애플리케이션에서 제공하는 도움말 정보입니다.

        # ab -h
          Usage: ab [options] [http[s]://]hostname[:port]/path
          Options are:
          -n requests     Number of requests to perform
          -c concurrency  Number of multiple requests to make
          -t timelimit    Seconds to max. wait for responses
          -b windowsize   Size of TCP send/receive buffer, in bytes
          -p postfile     File containing data to POST. Remember also to set -T
          -u putfile      File containing data to PUT. Remember also to set -T
          -T content-type Content-type header for POSTing, eg.
          'application/x-www-form-urlencoded'
          Default is 'text/plain'
          -v verbosity    How much troubleshooting info to print
          -w              Print out results in HTML tables
          -i              Use HEAD instead of GET
          -x attributes   String to insert as table attributes
          -y attributes   String to insert as tr attributes
          -z attributes   String to insert as td or th attributes
          -C attribute    Add cookie, eg. 'Apache=1234. (repeatable)
          -H attribute    Add Arbitrary header line, eg. 'Accept-Encoding: gzip'
          Inserted after all normal header lines. (repeatable)
          -A attribute    Add Basic WWW Authentication, the attributes
          are a colon separated username and password.
          -P attribute    Add Basic Proxy Authentication, the attributes
          are a colon separated username and password.
          -X proxy:port   Proxyserver and port number to use
          -V              Print version number and exit
          -k              Use HTTP KeepAlive feature
          -d              Do not show percentiles served table.
          -S              Do not show confidence estimators and warnings.
          -g filename     Output collected data to gnuplot format file.
          -e filename     Output CSV file with percentages served
          -r              Don't exit on socket receive errors.
          -h              Display usage information (this message)
          -Z ciphersuite  Specify SSL/TLS cipher suite (See openssl ciphers)
          -f protocol     Specify SSL/TLS protocol (SSL2, SSL3, TLS1, or ALL)

    Watson Explorer Engine 설치에 대한 로드 테스트 방법의 예제는 다음과 같습니다.

        # ab -n 1000 -c 10 http://localhost/velocity/cgi-bin/query-meta
          This is ApacheBench, Version 2.3 <$Revision: 655654 $>
          Copyright 1996 Adam Twiss, Zeus Technology Ltd, http://www.zeustech.net/
          Licensed to The Apache Software Foundation, http://www.apache.org/
    
          Benchmarking localhost (be patient)
          Completed 100 requests
          Completed 200 requests
          Completed 300 requests
          Completed 400 requests
          Completed 500 requests
          Completed 600 requests
          Completed 700 requests
          Completed 800 requests
          Completed 900 requests
          Completed 1000 requests
          Finished 1000 requests
    
          Server Software:        Apache/2.2.15
          Server Hostname:        localhost
          Server Port:            80
          Document Path:          /velocity/cgi-bin/query-meta
          Document Length:        140256 bytes
    
          Concurrency Level:      10
          Time taken for tests:   55.911 seconds
          Complete requests:      1000
          Failed requests:        65
          (Connect: 0, Receive: 0, Length: 65, Exceptions: 0)
          Write errors:           0
          Total transferred:      140402934 bytes
          HTML transferred:       140255934 bytes
          Requests per second:    17.89 [#/sec] (mean)
          Time per request:       559.107 [ms] (mean)
          Time per request:       55.911 [ms] (mean, across all concurrent requests)
          Transfer rate:          2452.35 [Kbytes/sec] received
    
          Connection Times (ms)
          min  mean[+/-sd] median   max
          Connect:        0    0   0.0      0       1
          Processing:   366  558 104.9    541    1350
          Waiting:      353  528 104.5    511    1320
          Total:        366  558 104.9    541    1350
          Percentage of the requests served within a certain time (ms)
          50%    541
          66%    570
          75%    593
          80%    605
          90%    650
          95%    701
          98%    941
          99%   1059
          100%   1350 (longest request)

    위의 테스트는 이 Watson Explorer Engine 인스턴스를 실행하는 서버가 초당 17.89개의 요청을 처리할 수 있음을 나타냅니다. 이 결과는 query-meta를 실행하고 example-metadata 콜렉션을 검색하는 기본 구성으로 얻은 결과입니다.

    meta-searching 및 검색 콜렉션을 사용한 검색에 대한 로드 테스트 출력은 다음과 같습니다.

        # ab -n 100 -c 10 "http://localhost/velocity/cgi-bin/query-meta?v:project=query-meta&query=news"
          This is ApacheBench, Version 2.3 <$Revision: 655654 $>
          Copyright 1996 Adam Twiss, Zeus Technology Ltd, http://www.zeustech.net/
          Licensed to The Apache Software Foundation, http://www.apache.org/
          Benchmarking localhost (be patient).....done
    
          Server Software:        Apache/2.2.15
          Server Hostname:        localhost
          Server Port:            80
          Document Path:          /velocity/cgi-bin/query-meta?v:project=query-meta&query=news
          Document Length:        124894 bytes
          Concurrency Level:      10
          Time taken for tests:   70.536 seconds
          Complete requests:      100
          Failed requests:        99
          (Connect: 0, Receive: 0, Length: 99, Exceptions: 0)
          Write errors:           0
          Total transferred:      12478129 bytes
          HTML transferred:       12463429 bytes
          Requests per second:    1.42 [#/sec] (mean)
          Time per request:       7053.553 [ms] (mean)
          Time per request:       705.355 [ms] (mean, across all concurrent requests)
          Transfer rate:          172.76 [Kbytes/sec] received
    
          Connection Times (ms)
          min  mean[+/-sd] median   max
          Connect:        0    0   0.1      0       0
          Processing:  2666 6838 1842.3   6547   13812
          Waiting:     2650 6822 1842.5   6533   13798
          Total:       2666 6838 1842.3   6547   13812
    
          Percentage of the requests served within a certain time (ms)
          50%   6547
          66%   7243
          75%   7676
          80%   8149
          90%   8995
          95%  10025
          98%  13689
          99%  13812
          100%  13812 (longest request)

    meta-searching이 조회에 포함되는 경우 성능에 현저한 차이가 있음을 확인할 수 있습니다. 첫 번째 실행은 평균적으로 0.5초에 완료된 총 1000개의 요청(10개 동시)이 있는 검색 콜렉션에 대한 것입니다. 두 번째 실행은 평균적으로 6.5초에 완료된 총 100개의 요청(10개 동시)이 있는 콜렉션 및 연합 소스에 대한 것입니다. 연합을 사용하도록 설정한 후에 10번째 요청의 완료 시간은 13배 더 늘어났습니다.


    + Recent posts